Chart
Generate a chart image file output.png from a specified CSV format data source.
Parameters
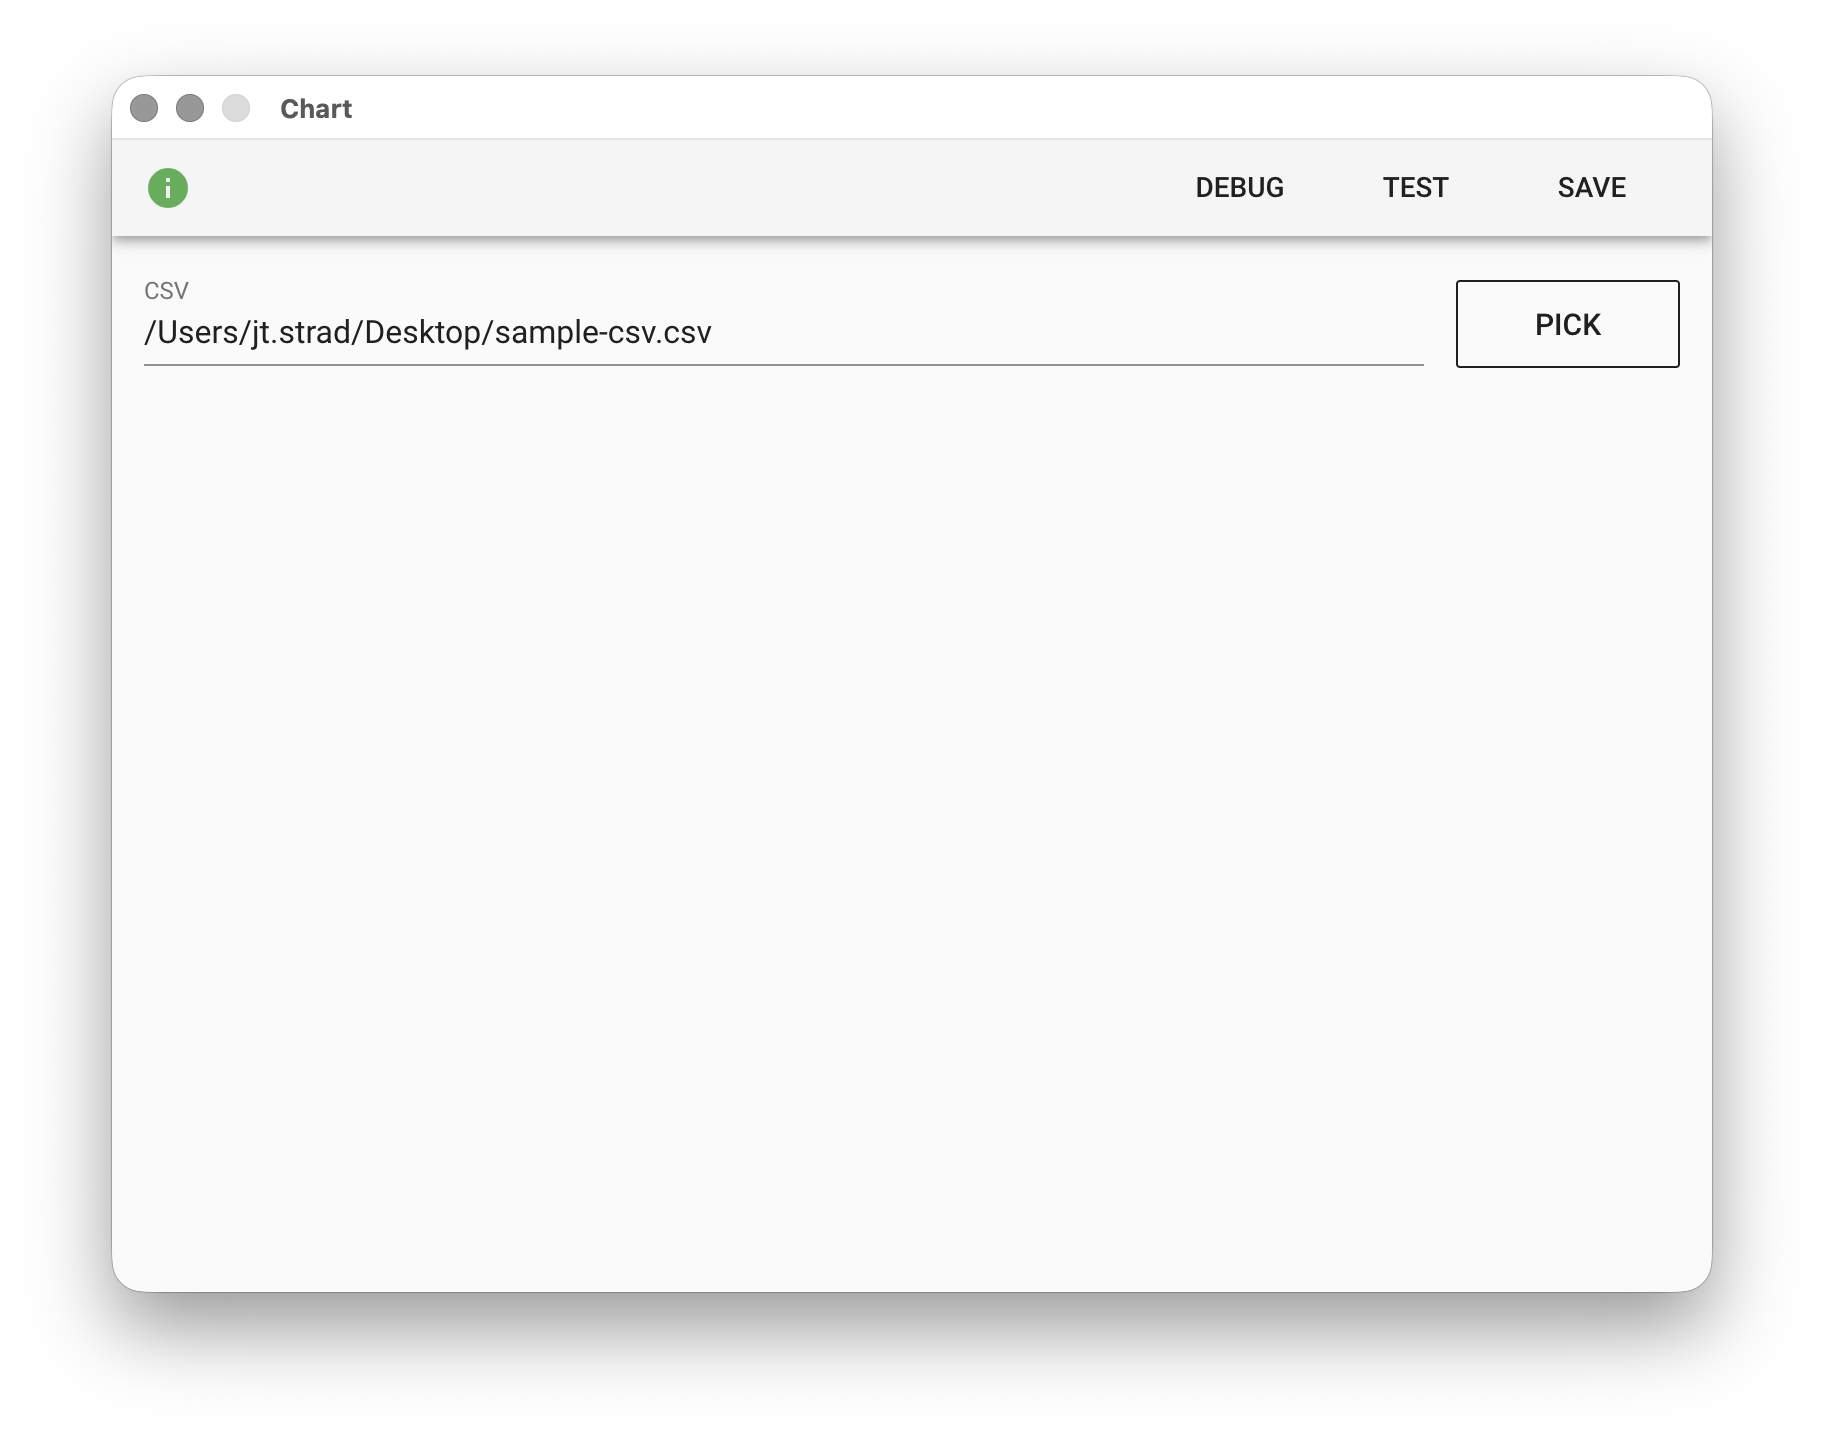
CSV - A CSV format data source. Click PICK to select a file path, enter a filename to use a file from the working folder, or use the %FILENAME% variable.
Input File
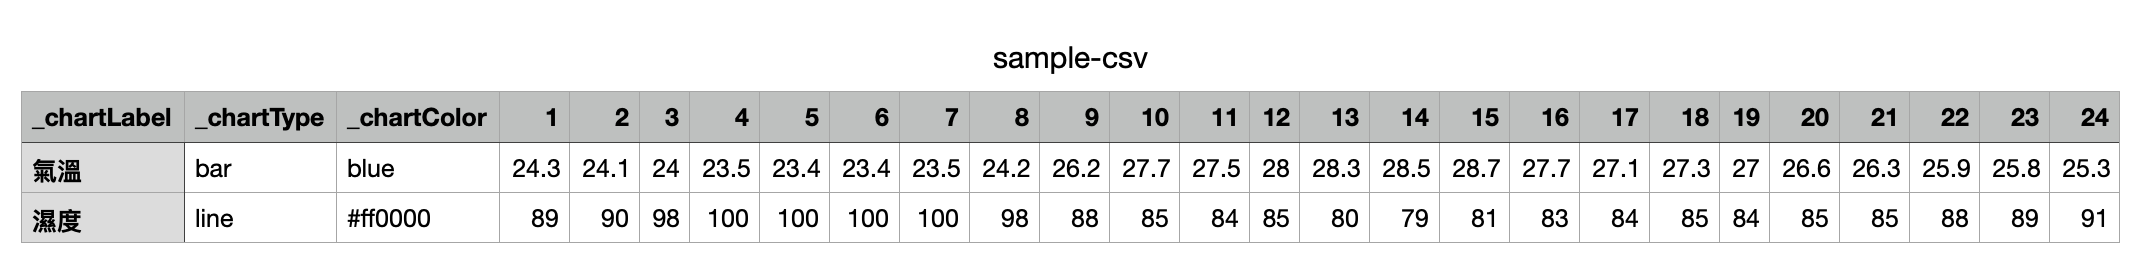
When the Chart module parses CSV data, regular column headers are used to plot the horizontal axis of the chart, and the numeric values in each data row corresponding to the column headers are used to plot the vertical axis. Note that only numeric data types will be used for chart plotting; other types such as text will be ignored. Special column headers prefixed with _chart are treated as chart configuration parameters by the module, for example:
_chartLabel - Specifies the label for the data row.
_chartType - Specifies the chart type for the data row. There are three types: bar, line, area.
_chartColor - Specifies the chart color for the data row, using CSS color notation, for example: red, #00ff55
Output File
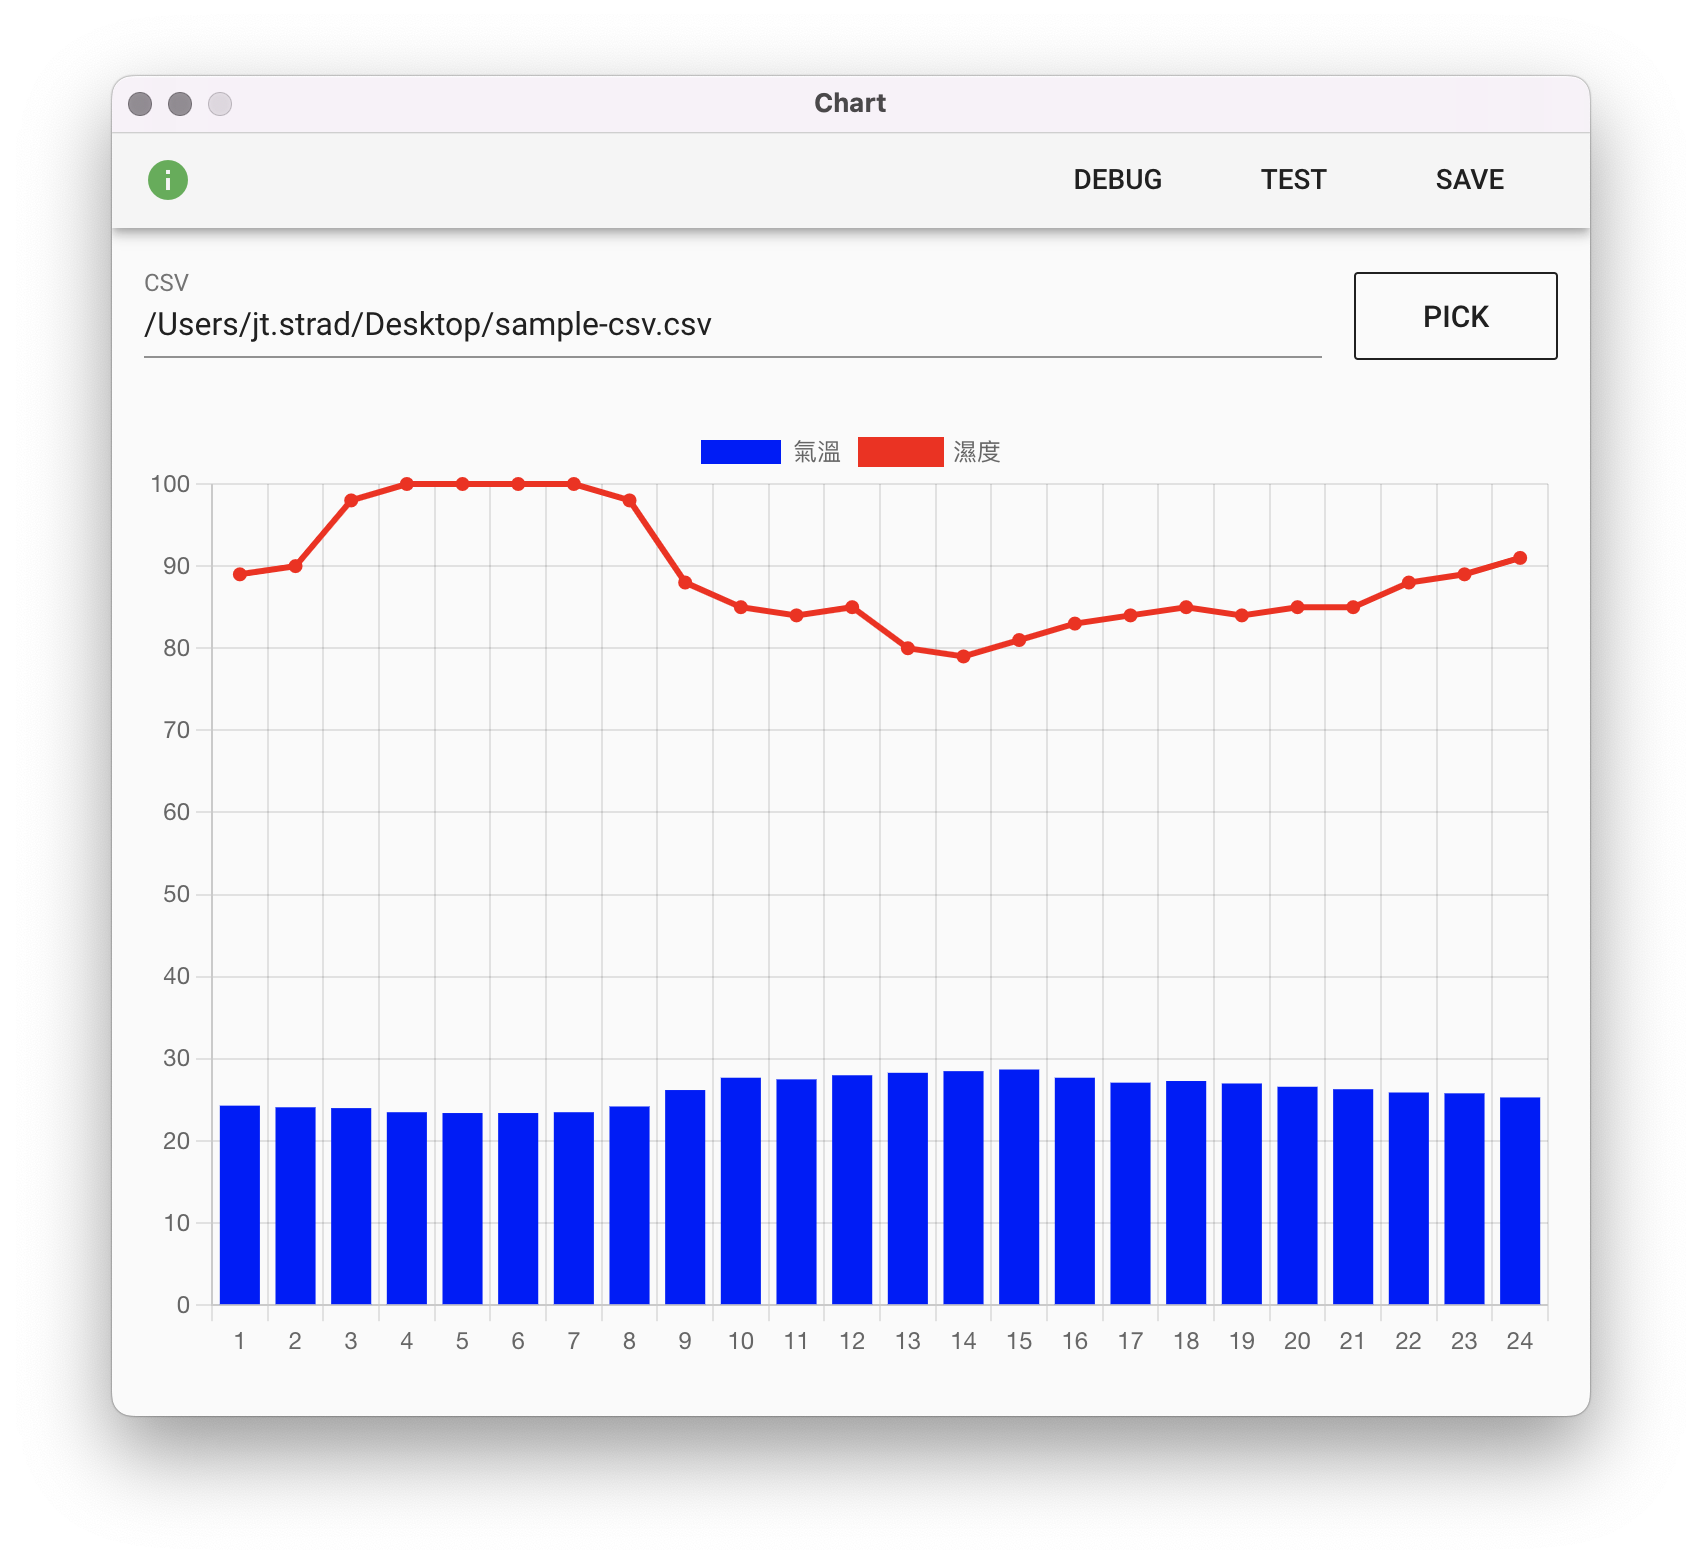
In training mode, pressing "TEST" will trigger the module to render the chart and output output.png to the working folder: